Blog | The Thanksgiving Market Rally
tl;dr
Market returns during the week of Thanksgiving tend to beat weekly averages.
Since 1945, gains this week are approx. +0.38% better than average.
Volatility is comparable to the rest of the year.
It’s been 233 years since George Washington first encouraged Americans to take “a day of public thanksgiving and prayer” on Thursday, Nov. 26, 1789 — which, if you’re playing along at home, makes it one of the first Presidential actions, period.
Such is the power of a truly great home-cooked meal.
The markets will be closed this Thursday, as they always are on the last Thursday of November in the U.S.
But we’ve been talking about seasonality recently, and before we all take a break, let’s look at another strongly evident cycle in the markets: the Thanksgiving rally.
Evidence for the Thanksgiving Rally
My friends over at Bespoke.com have run the numbers on the returns of every Thanksgiving week from 1945 to 2020. Here’s what they found:


Day-by-day breakdown of stock market returns during the week of Thanksgiving.
Thanksgiving is something of a “gateway holiday.” It marks the informal beginning of the Christmas season (though TV ads have already been airing for a month).
This is a time of year that kicks off a season of celebration, with two important spiritual holidays that are full of joy of and hope—the celebration of the birth of Jesus, and the eight days of Hanukkah.
This “looking forward with excited anticipation” gives a sense of optimism to investors. Plus the gathering of family and friends to be thankful (oh yeah—and to eat good food and watch football and shop Black Friday/Cyber Monday deals, and…).
All combine to give the market an unusual upward bias for the Thanksgiving week rally.
Looking deeper at the rally
A few things to consider:
We’ve said it before and we’ll say it again: past performance doesn’t indicate future results.
These are all averages! To benefit from this trend, even if it continues in future years, you have to act on it over many years.
Any given year can deviate from the long-term norms.
A few outliers to consider:
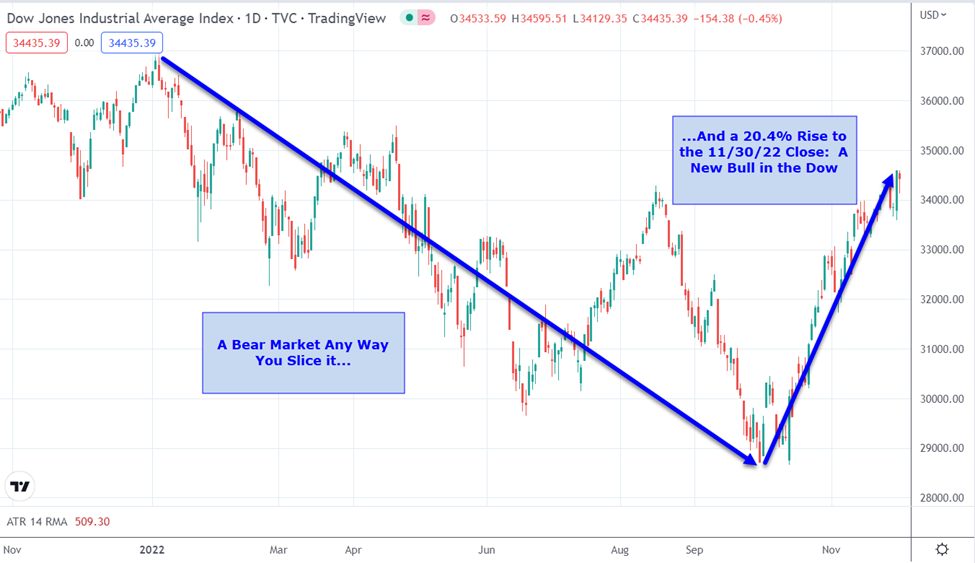
The amazing 2008 Thanksgiving week return of +12.0%.
The huge downside slide of 2011 of -4.7%
The 2021 swoon of -2.5%
All of that drop last year came in Friday’s half a day of trading.
I tell you all of this, so that we can understand seasonal tendencies as probabilities that tilt in our favor—not as sure things.
Volatility in seasonal cycles
Here's a question that a curious Financial Brainiac (Finiac) should ask:
Is there added risk or volatility during Thanksgiving week?
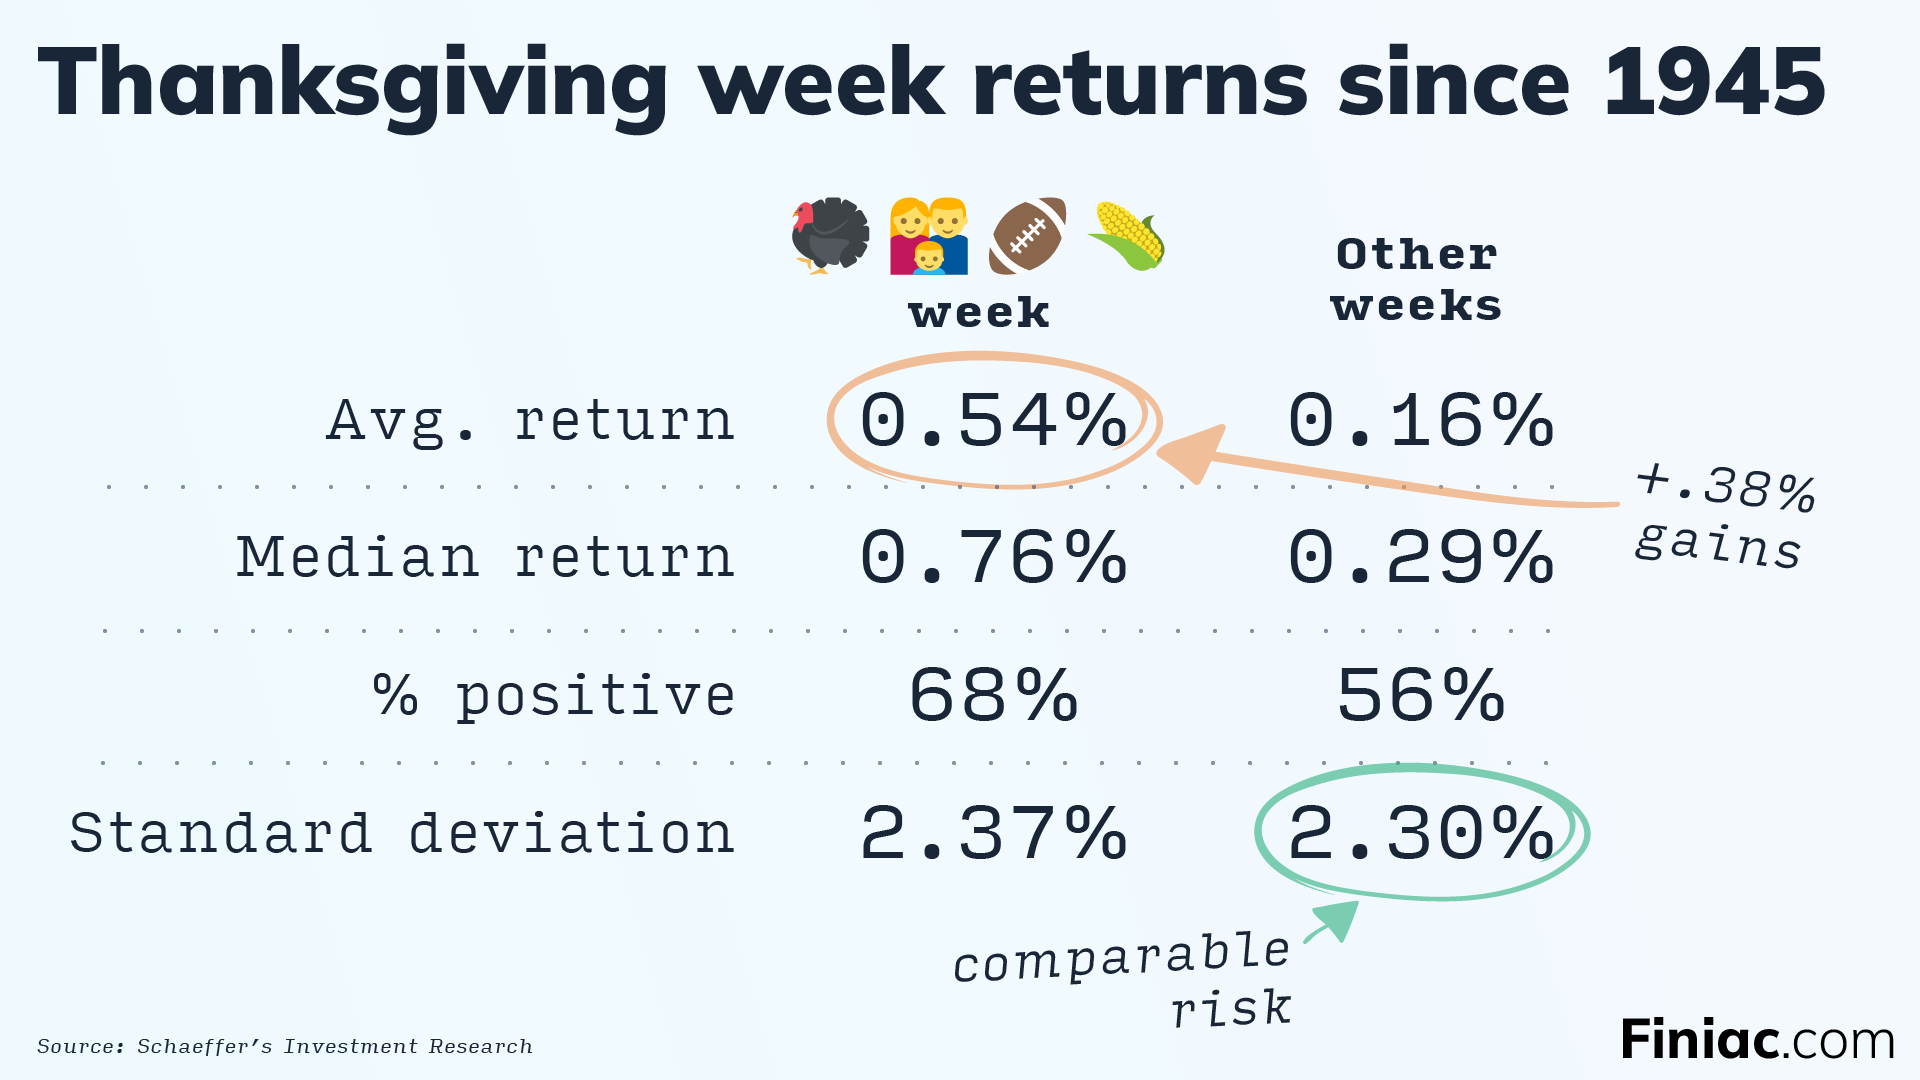
Looking at those few volatile numbers from the last paragraph, you might think so. But the actual results may come as a surprise. The folks at Schaeffer’s Investment Research have looked at the last 50 Thanksgiving Weeks and compared them to an average for the other weeks of the year:

Table showing stock market returns during the week of Thanksgiving compared to the rest of the year, with data since 1972.
Comparing Thanksgiving week to all the other weeks of the year for 50 years, you get a much higher win rate and average return with very little additional added risk. Those are some impressive results.
I’d like to wish you a very happy Thanksgiving time, regardless of whether this week is your country’s official celebration!
God bless you and Great Investing,
D. R. Barton, Jr.
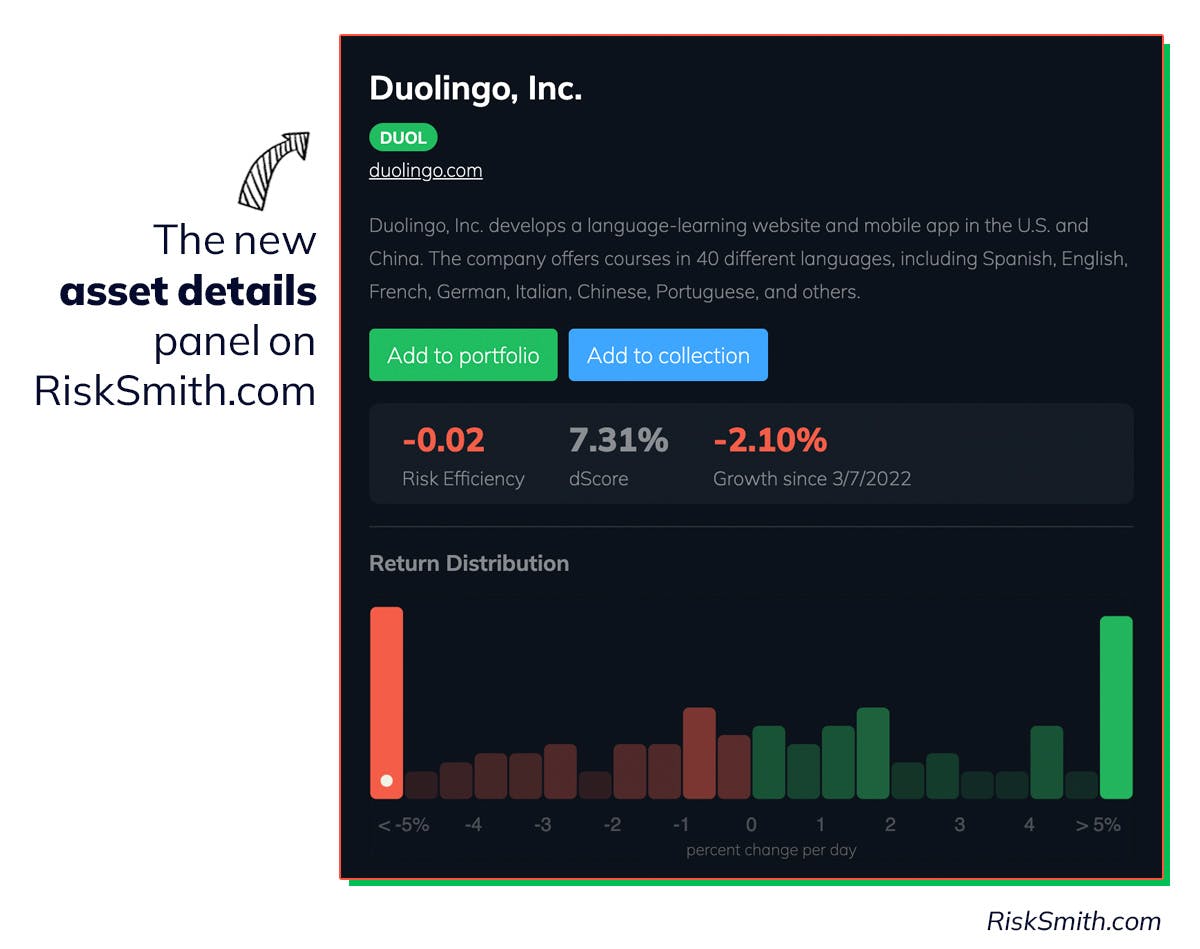
Don't fall prey to loss aversion
Design better portfolios with RiskSmith


Related Posts