How to Calculate Correlation Between Two Stocks
Here are three ways. (Hint: our new Correlation Calculator is the easiest)


Justin Davis
December 16th, 2022


Blog | How to Calculate Correlation Between Two Stocks
tl;dr
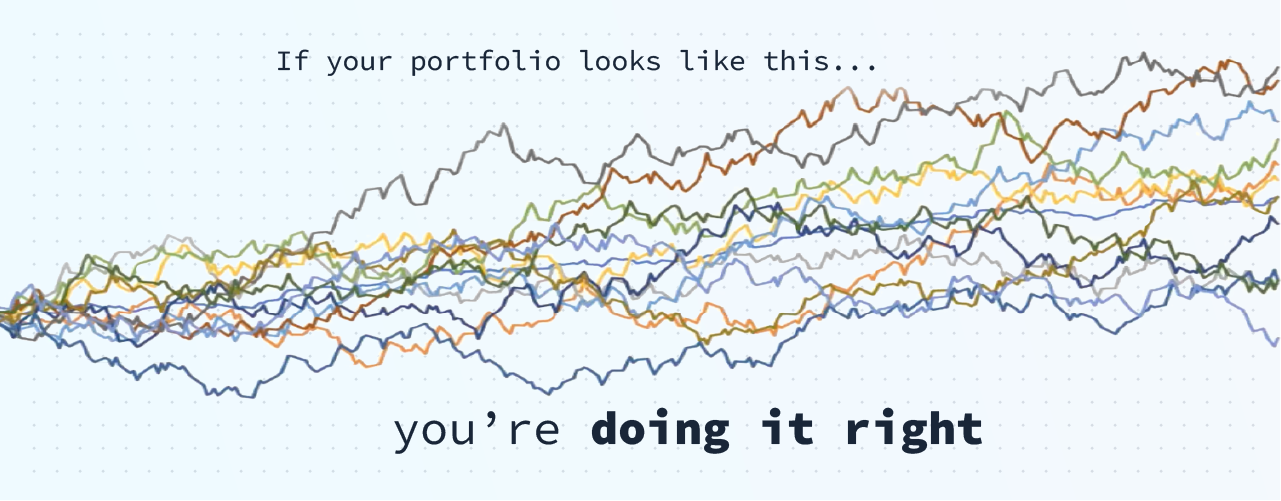
Correlation in a portfolio has a huge effect on returns.
Most investors don’t track it because it’s tough to calculate.
Use Finiac’s Correlation Calculator to quickly understand your correlation.
The correlation between two assets—let’s just say stocks, for example—has a huge effect on the amount of risk associated with that investment.
Just so we’re clear:

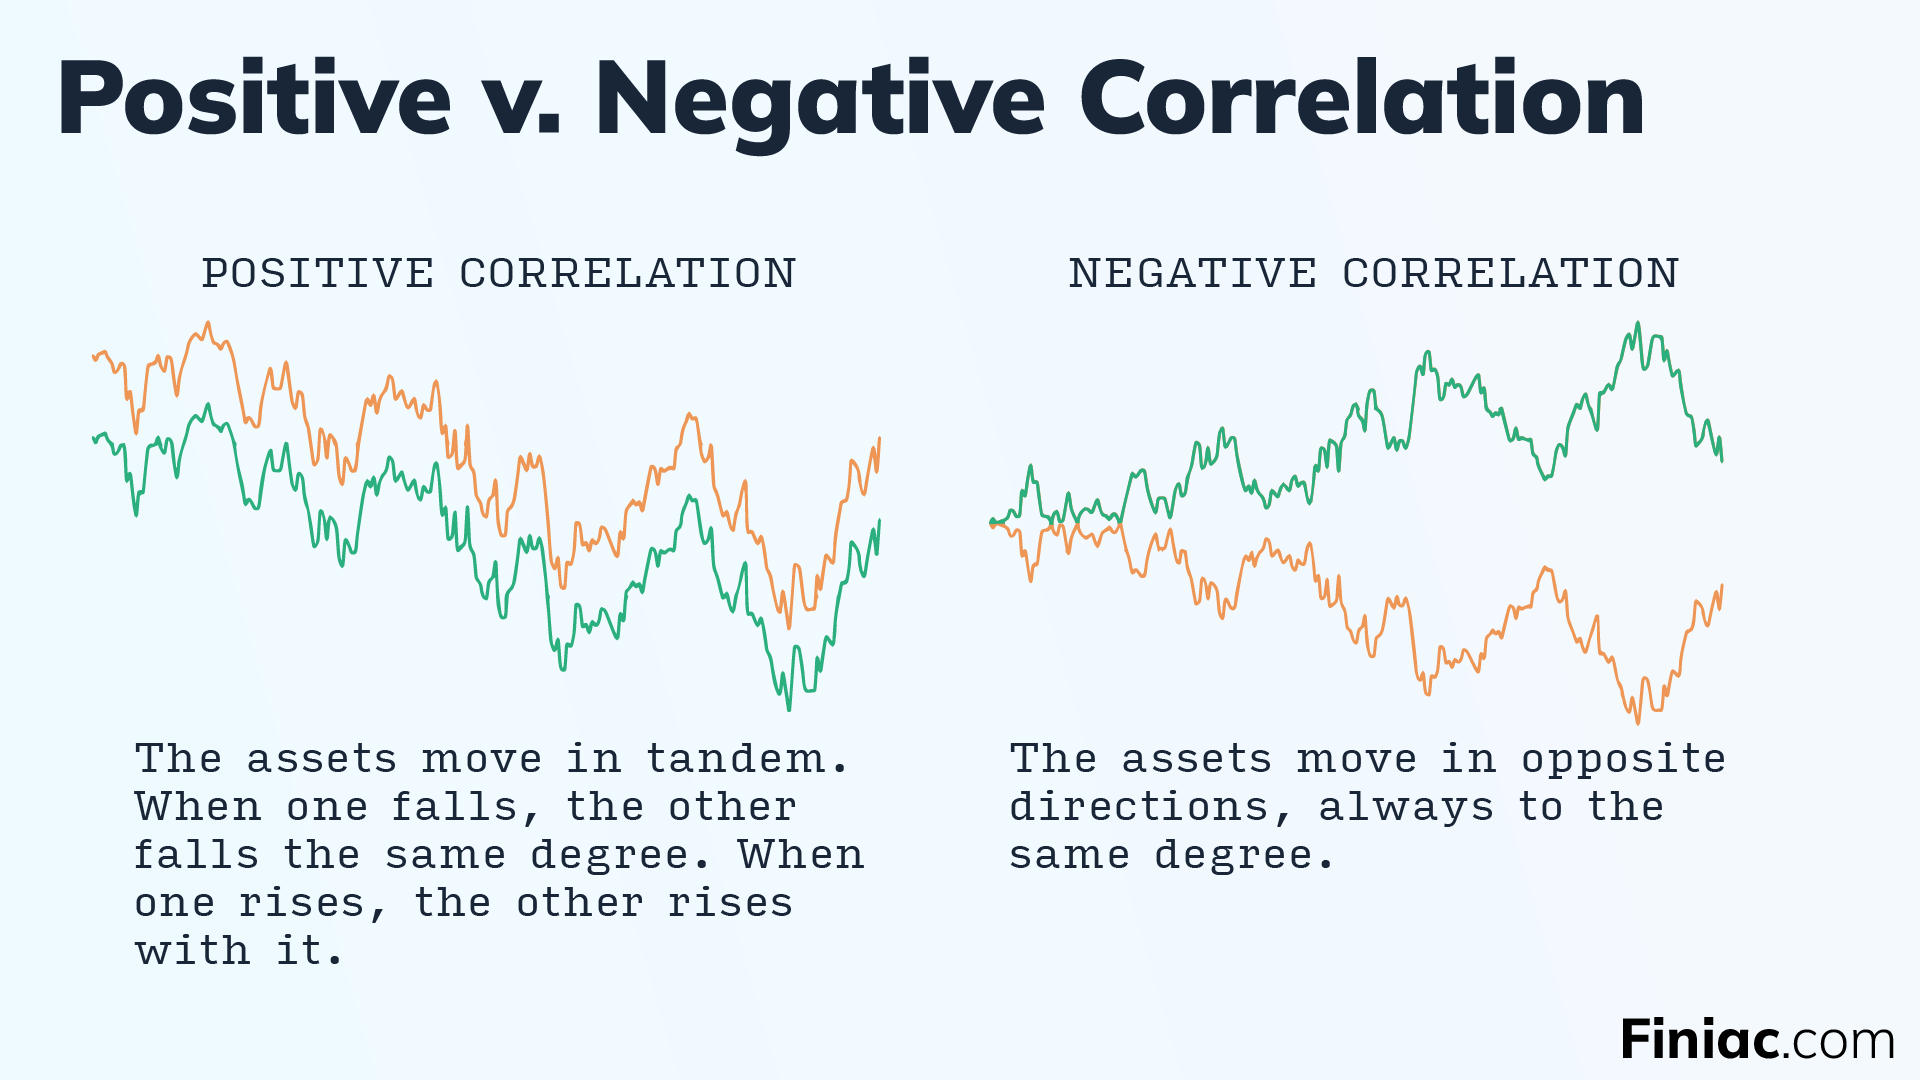
Infographic explaining the difference between positive and negative correlation.
It’s easy to understand why positive correlation increases your risk: if your assets move together, then the down days are down all across the board.
But it’s just as important to grasp the way minimal correlation reduces your risk enormously.
Imagine two waves in the ocean. If they break simultaneously, in the same place, they amplify each other to make one big crash. But if they happen at different times, they offset each other. No heavy clash—just a bit of chop here and there. That’s what you want: a smooth ocean.
That’s basically how correlation between assets affects the overall volatility—or waviness—of your portfolio’s returns.
Let’s look at three ways to calculate it. Though, hint hint, you could just skip to the easy way.
The hard way: calculate correlation by hand
The most common way to calculate correlation is by using the Pearson coefficient. Developed in the 1880s by Karl Pearson, this is the most widely used formula to determine how correlated two things are.
The Pearson coefficient can be calculated using the following formula:


Graphic showing the formula to calculate the Pearson correlation coefficient of two assets.
This formula states that you can calculate the Pearson coefficient by taking the covariance of two values, and dividing that by the product of the standard deviation for each item.
If this looks a little…intimidating…you’re in luck, there are much easier ways to get at this number!
A bit easier: calculate correlation in Excel
Excel can make it much easier to calculate correlation. To calculate the correlation coefficient between two values in Excel, you can use the CORRELformula.
To use this for calculating correlation between two stocks or assets, do the following:
Gather the returns (any interval works; daily is easiest) for two assets. Historical data is available free on sites like Yahoo Finance. What you’re looking for is the daily % change, going back, say, 1 year.
You’ll have two columns of data, one for each asset you’re comparing.
Paste the the two columns of data right alongside each other in Excel, like so:

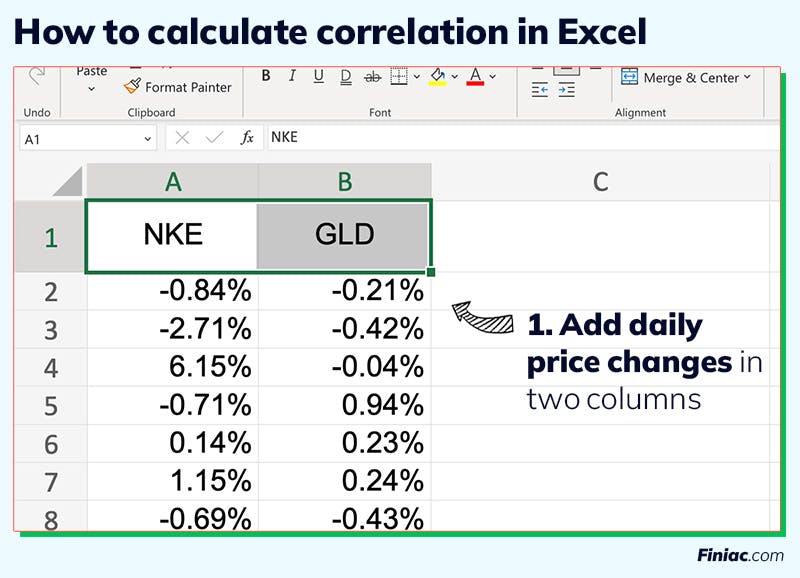
Graphic explaining how to calculate correlation of stocks in Excel.
If you’re working with stocks, and one year of data, you’ll have about 250 rows in each column.
In the next column over, use the CORREL function to calculate the correlation coefficient. Take a look in the function bar below:
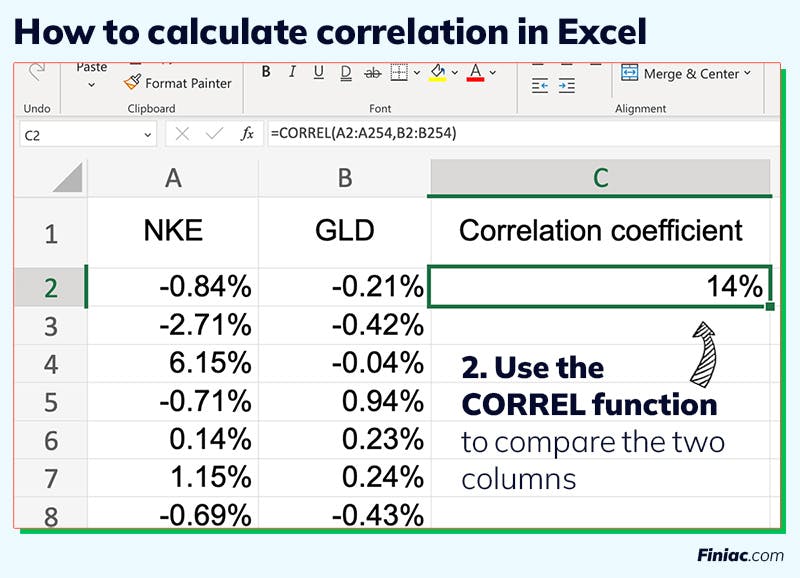
Graphic explaining how to calculate correlation of two stocks in Excel.
In this case, the function would be: =CORREL(A2:A254,B2:B254).
Voila! There’s your correlation for those two assets.
Easiest: use the Correlation Calculator
We built our correlation calculator to save you from breaking out pencil sharpener or even opening a spreadsheet.
Here’s how it works:
Enter the ticker for the first stock. Let’s use the same example, Nike. Type NKE, then hit enter
Repeat for the next asset, GLD, and hit enter
Click “Calculate Correlation”
That’s it—now you’ve got the correlation:

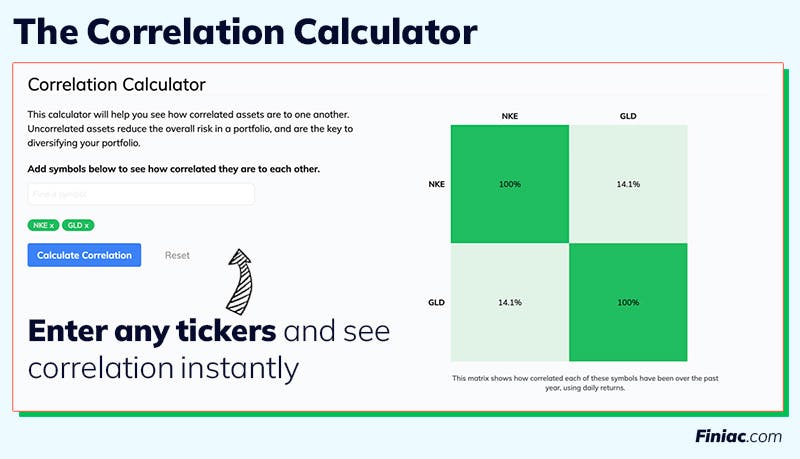
Enter any tickets and see correlation between them instantly.
What’s nice about this tool is you can actually go further—add any other symbols you want to compare. Let’s add Apple (AAPL), Tesla (TSLA) and the S&P500 index (SPY).
Now you can see the correlation for every pair among all those assets. Just look at their intersections on the grid:
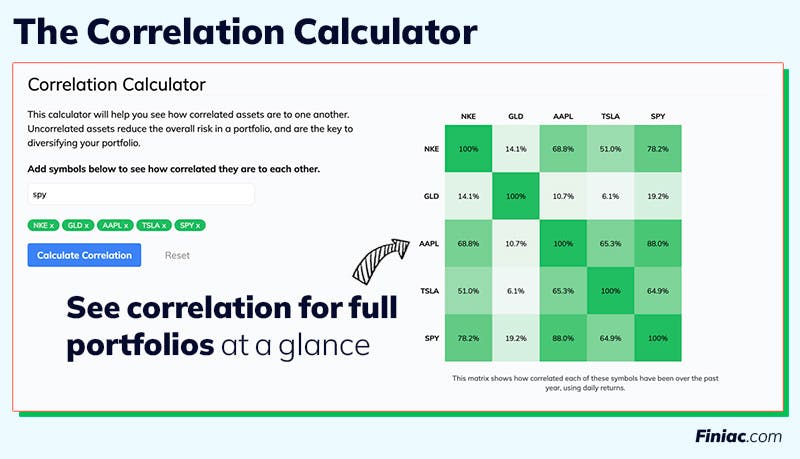
See correlation for full portfolios at a glance.
Click here to look at that 👆 exact correlation profile
Put it to work: use correlation to optimize a portfolio
Let’s go back to that wave example from earlier. Just like smoother seas tend to result in a safer, more enjoyable experience, so will a smoother portfolio return stream. If your daily returns are less volatile, you’ll be less susceptible to the psychological trickery that risk can play on your brain.
The end result? A portfolio that performs better and lets you sleep at night.
To use correlation to your advantage, try checking the correlation between two assets before you invest in them. As you build your portfolio, look to ensure at you’re putting together a set of investments that are as uncorrelated as possible (that is, their correlation coefficient is as close to zero as possible).
Taking this to the next level, you can also use the Correlation Calculator to calculate the correlation of an asset to your portfolio as a whole (hint: the return stream for your portfolio, that is, the day-to-day value change, works the same way in this formula as any other asset). By doing this, you’ll ensure that every new investment you add to your portfolio helps reduce your risk, rather than unknowingly increasing that risk.
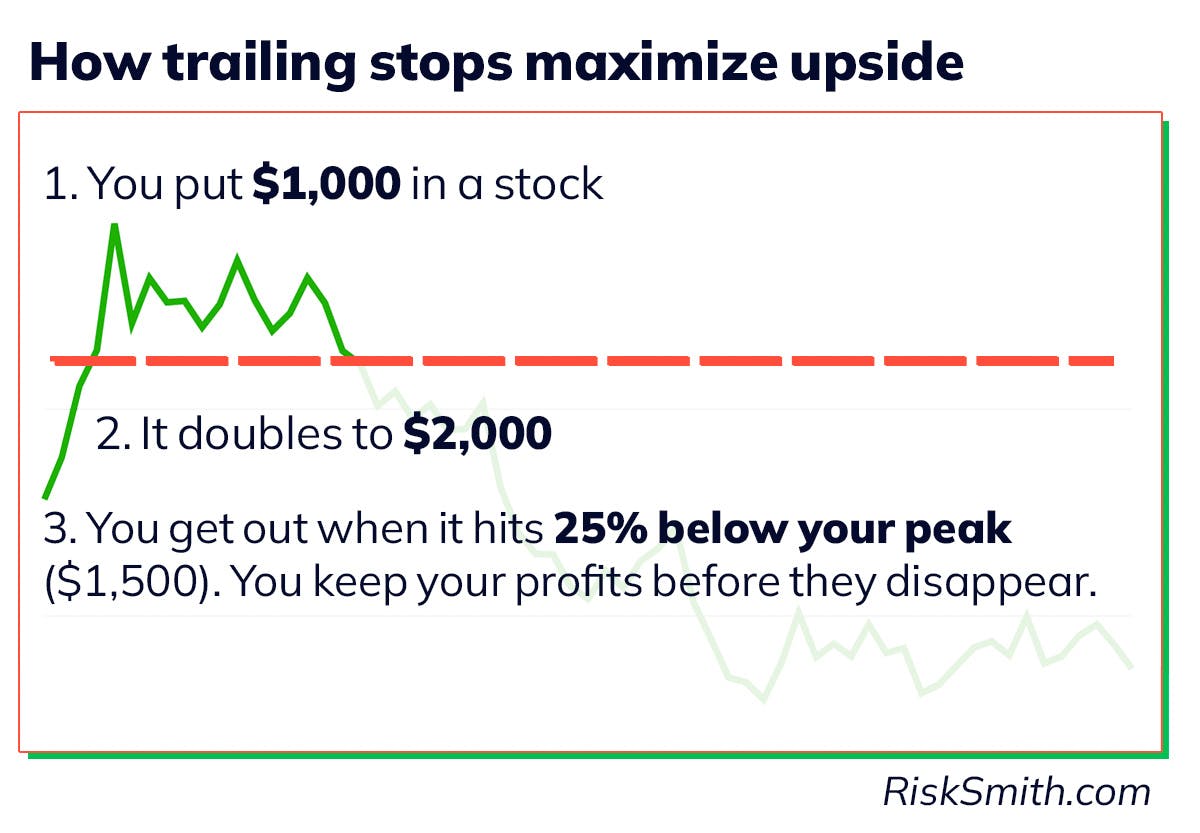
Don't fall prey to loss aversion
Design better portfolios with RiskSmith


Related Posts