Analyzing a Portfolio from Reddit
This Redditor is looking to "reduce overlap and diversify my portfolio." Can do!


Dr. Richard Smith
February 6th, 2023


Blog | Analyzing a Portfolio from Reddit
tl;dr
The owner is looking to "reduce overlap and diversify my portfolio."
Finiac's metrics show that dropping a few assets hit both of those goals.
The same 3-step analysis can be applied to any portfolio.
Today we’re looking at a portfolio that was posted on Reddit. Here’s w
During my early 20s, I let FOMO take over my portfolio and its time to finally clean up/reduce overlap.
My 401k is company managed, where I contribute 10%. I max my roth each year into VLXVX(Vanguard Target Retirement 2065), which should probably move to 2055 fund since I am 25 and will probably retire in 2055-2060.
Below is my current portfolio where I have been DCAing over the last few years. Please help me reduce overlap and diversify my portfolio. As a novice, it feels like I should get rid of ITOT or VOO(not sure which) and drop the percentage of AAPL and Microsoft if not remove them completely.
(Emphasis is ours.)
Basically, this portfolio is where he's putting spare income in hopes that it'll grow into a nest egg. He has an emergency fund, so unless something crazy happens, this will not be touched for five plus years.
We’re going to analyze the portfolio in 3 steps.
1. Correlation
First, let’s look at the correlation (or covariance) matrix, specifically at ITOT and VOO.
This is a grid showing how correlated each of the assets in the portfolio is with every other asset.

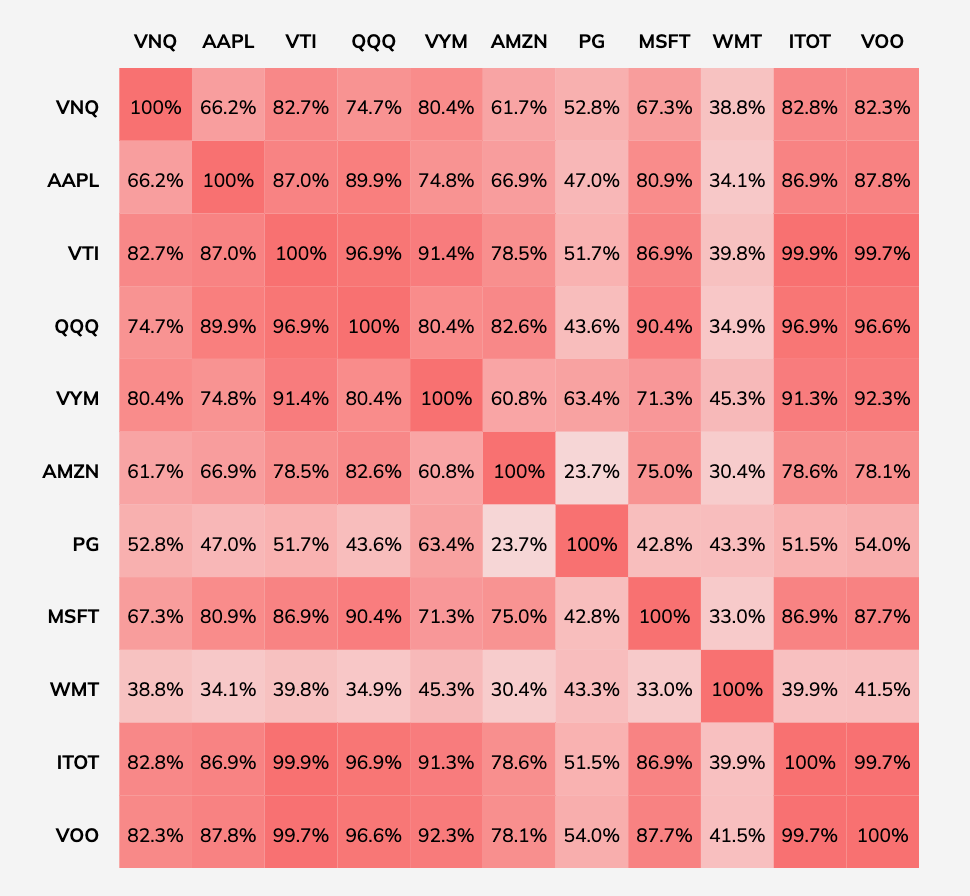
Look at ITOT and VOO , the two rows along the bottom. They’re deep red, which means they’ve got relatively high correlation with the rest of what’s in the portfolio.
So right off the bat, we know that dropping those might not be a bad idea, because they’re driving up the correlation of the portfolio as a whole.
Which means we’re ready to move onto step 2.
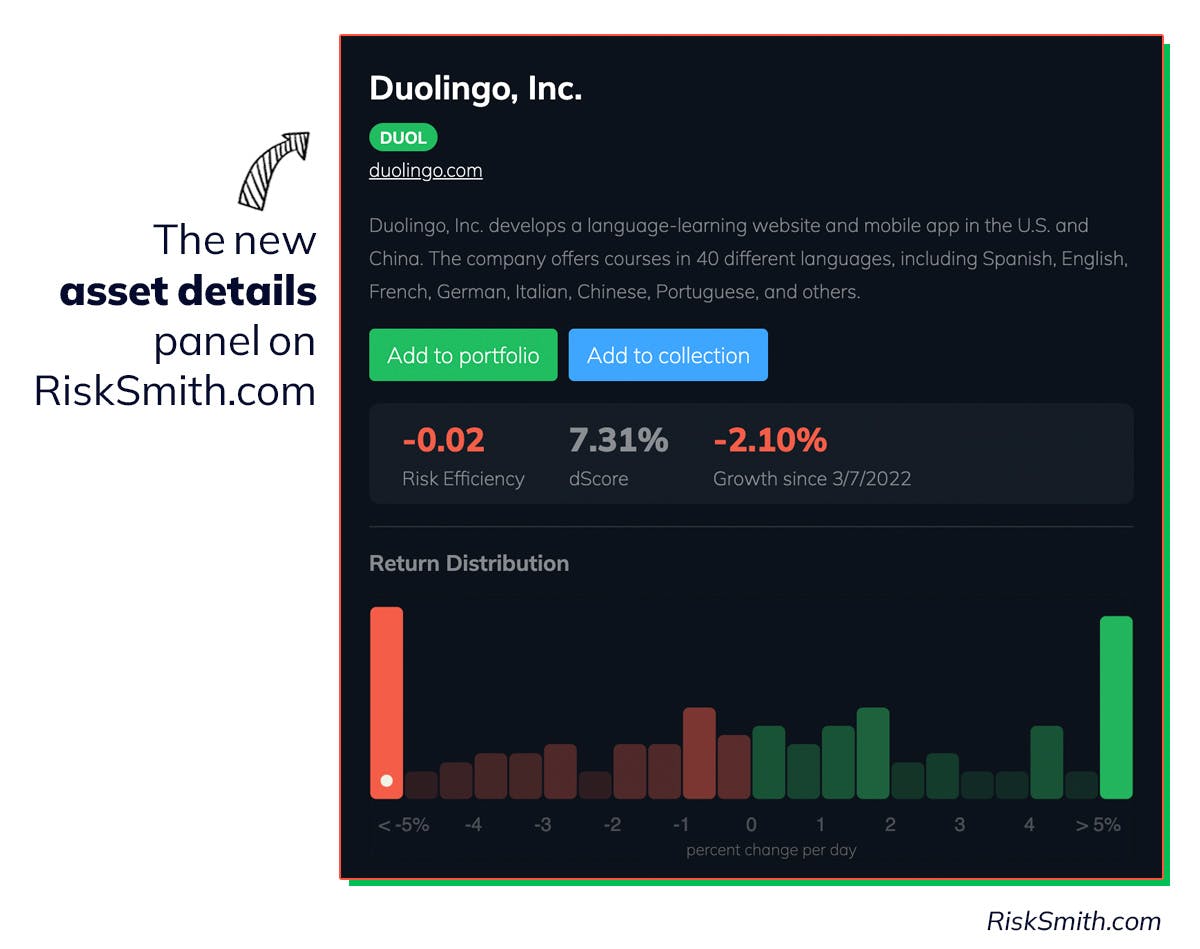
2. Performance
Now we want to look at actual performance. If you bought all of these assets a year ago, how would you have you done?
Here’s the answer, represented as a histogram:


Every day, the portfolio is up or down a given percentage. Each bar here represents a half-percentage point. All the way to the right is 5% up; all the way to the left is 5% down. The highest bars are in the middle, because most days were up or down less than 1%.
It’s pretty “normal,” given how rough the last year has been. We’d prefer not to see that highest spike in the bar for -0.5% to 0, but again, not too abnormal for most portfolios right now.
dScore tells us how volatile the portfolio is, and this one is at 2.64 dScore, which is in the vicinity of the S&P 500.
Here’s what’s interesting: we’re already considering dropping ITOT and VOO, and Finiac lets us see what that would be like.
And sure enough, when we drop those two assets, the dScore barely changes.
So they were right, up in that Reddit post: those two aren’t contributing to their diversification.
It tells us we could probably allocate that money in a more diversified way.
3. Risk Compression
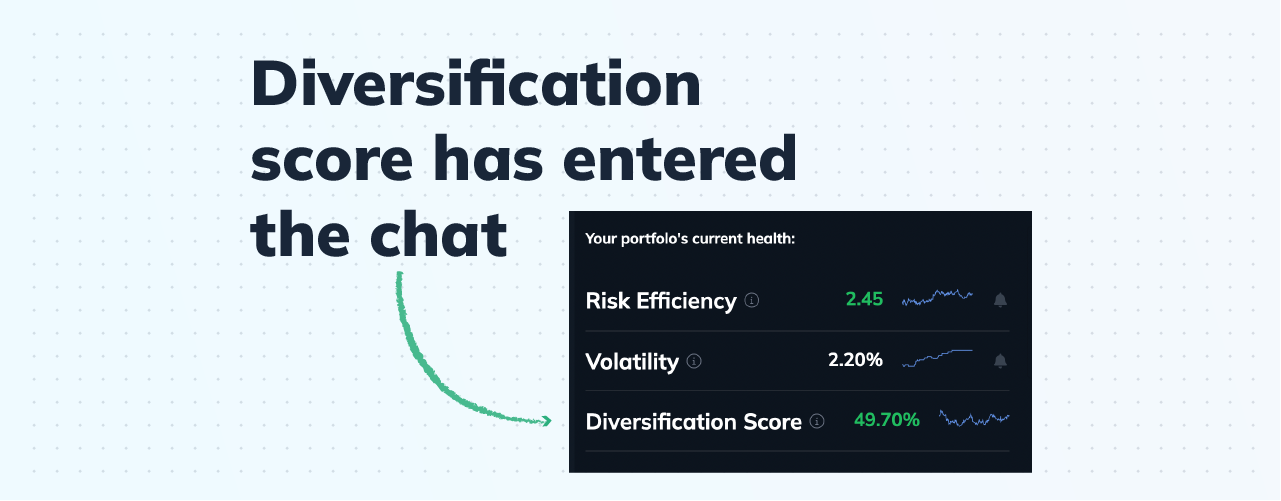
Finiac’s Diversification Calculator tells you not just how diversified you are, but how much effect that diversification is having on your returns. Diversification is meant to help you reduce your risk ultimately, and this helps you understand how well you’re reducing your risk through diversification.
A higher % is better — it means your diversification is having bigger positive effect.
A good target for this number is 25%. Which is tough to get, but we always want to aim high.
Here, we start with the full portfolio they described in the post. As we’re writing this, it’s at 13.78%, which is decent, but not spectacular.


Now let’s do what we did earlier—pop ITOT and VOO out of the mix.
These are the results when we do:


Bingo. The Risk Compression immediately went up.
Not only were ITOT and VOO not helping diversification; they were actually holding us back from getting the full impact of that diversification.
Basically, those two assets were redundant. They’re just repeating what was already in the portfolio.
Here’s the takeaway, for the portfolio owner:
Your instincts were dead on.
Got your eye on any other assets?
Repeat the steps above, only instead of subtracting assets, try testing those new additions. See if they give you a lower dScore and a higher Risk Compression.
If so, you know you’re on the right track.
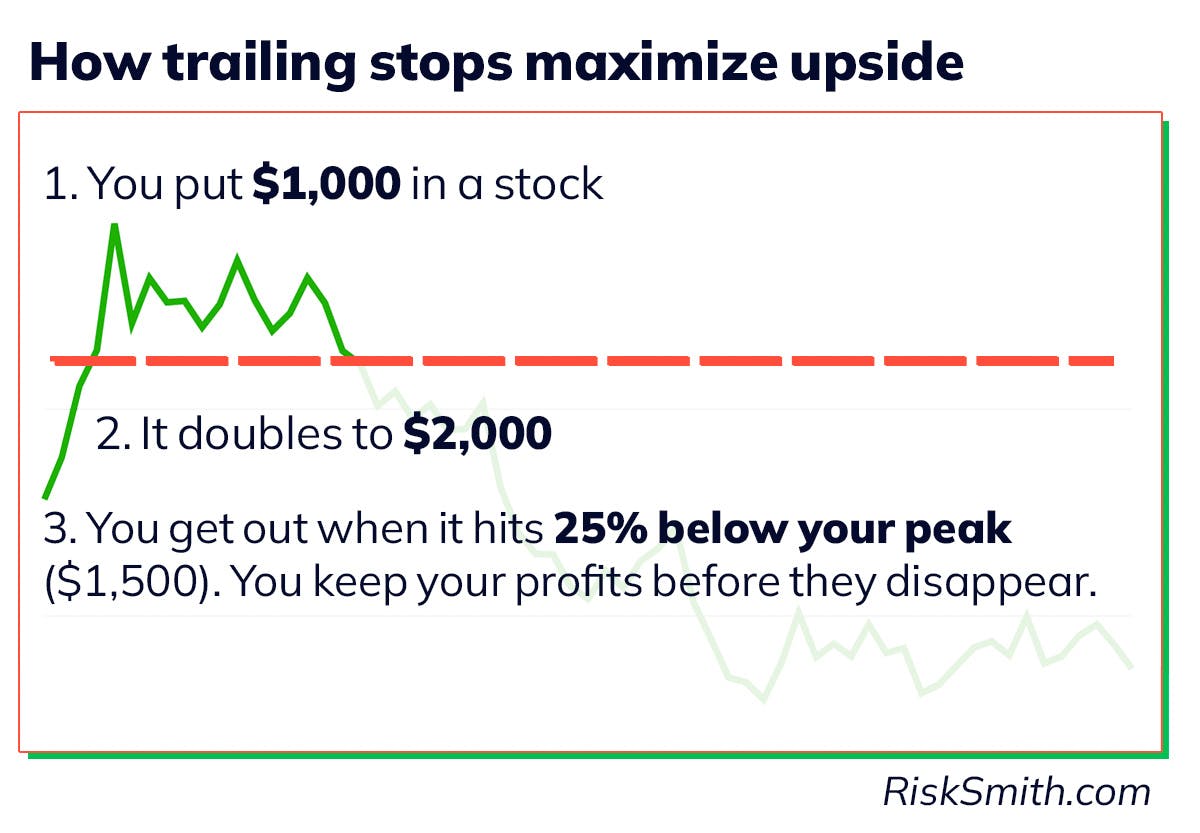
Don't fall prey to loss aversion
Design better portfolios with RiskSmith


dScore - A metric describing the amount you can expect to lose on an investment on your worst day in an average month. Equal to an asset’s 95% value-at-risk.
Other posts that mention terms dScore


Why you should care about volatility


Dr. Richard Smith

5 Questions to Ask Before Buying a Stock

Justin Davis
We built a better way to research assets

Dan Muse
Related Posts