tweezer
DEFINITION: A reversal pattern in technical analysis, commonly viewed as two successive candlesticks whose tops or bottoms are aligned. The pattern is referred to as a “tweezer” because the two candlesticks resemble the arms of a set of tweezers, whose ends meet perfectly.
A tweezer is a reversal pattern in technical analysis, commonly viewed as two successive candlesticks whose tops or bottoms are aligned. The pattern is referred to as a “tweezer” because the two candlesticks resemble the arms of a set of tweezers, whose ends meet perfectly.
Example of a bearish tweezer top
A bearish tweezer top occurs in an otherwise bullish trend when two candlesticks show a brief plateau, with even successive tops. The pattern is generally thought to indicate an impending reversal toward the downside.

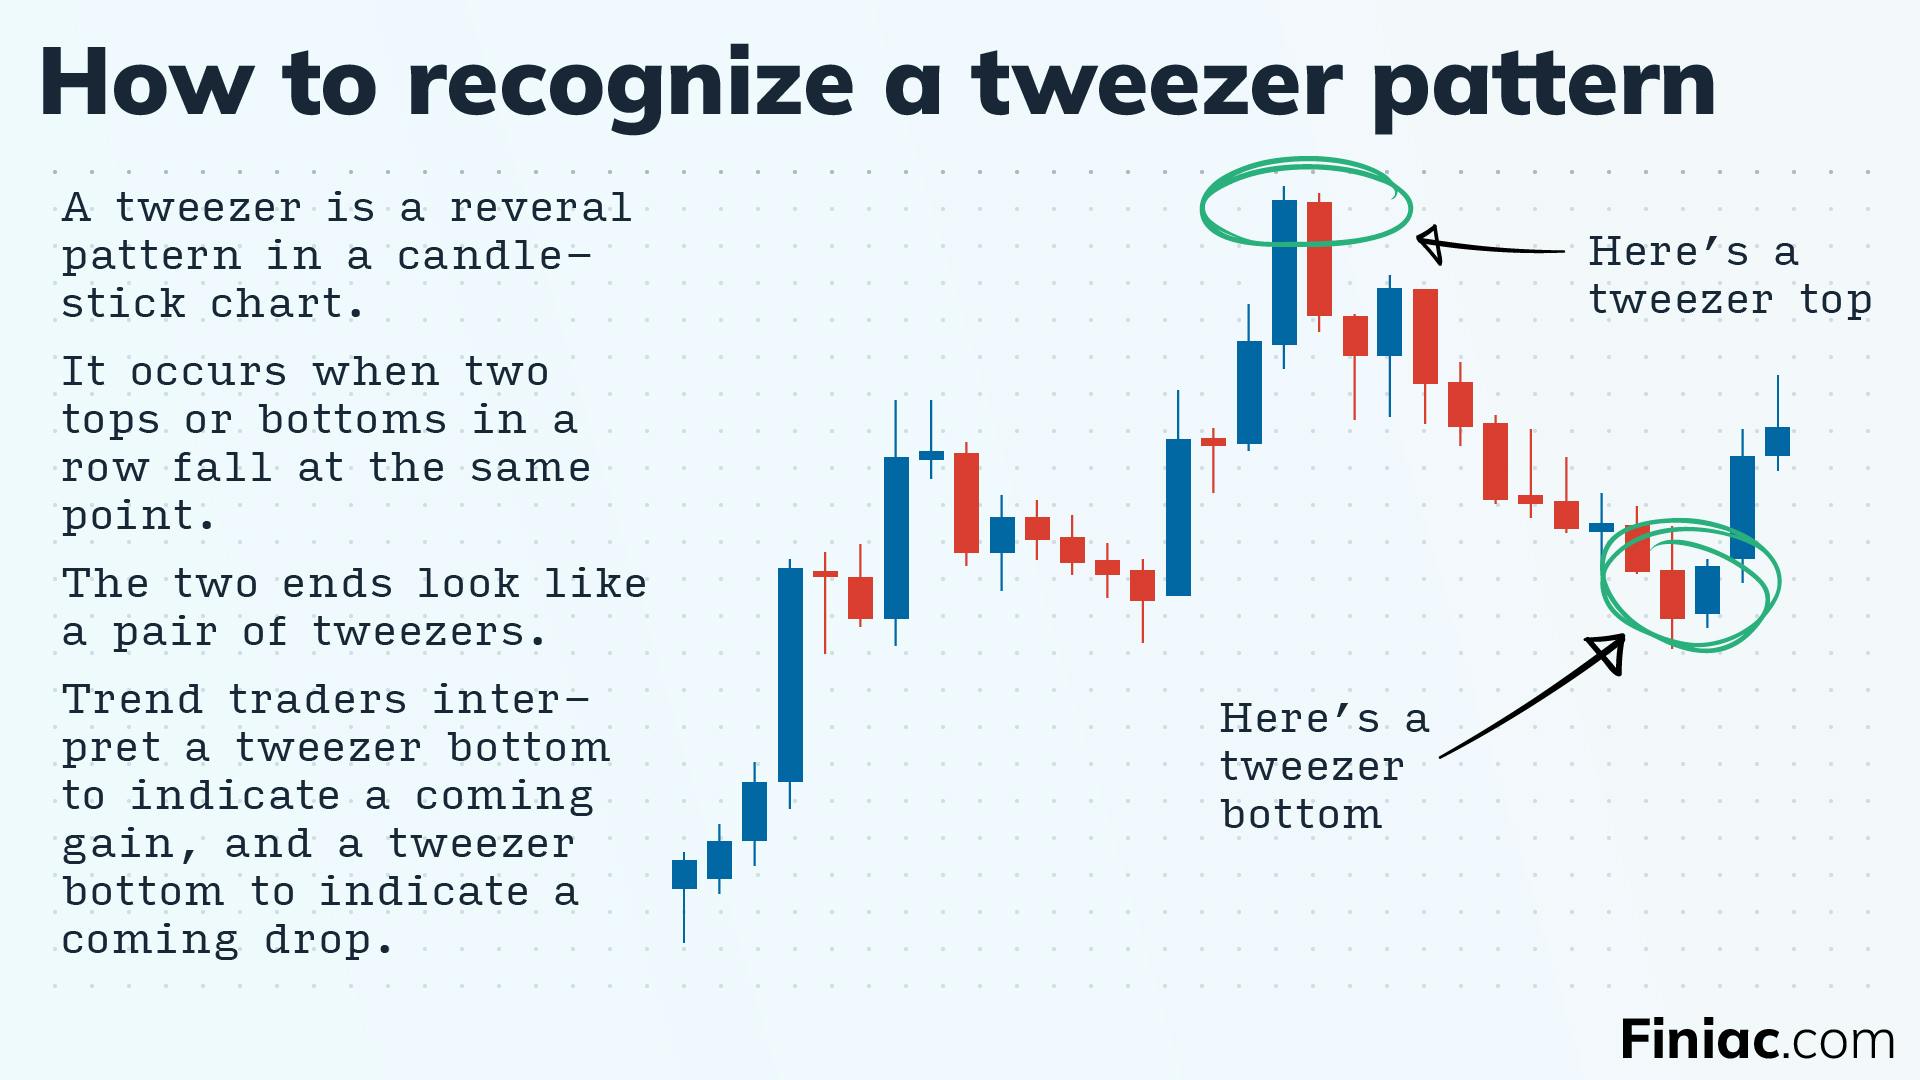
Infographic explaining how to read a tweezer pattern in a candlestick chart.
A bullish tweezer bottom occurs in an otherwise bearish trend when two candlesticks share a bottom. The pattern is generally thought to indicated an impending reversal toward the upside.
How tweezers are used by traders
The two examples in the graphic above are among the simplest interpretations of a tweezer pattern. Traders may use tweezers to attempt to identify broader trends in markets, and inform trade decisions.
Tweezers are generally integrated into a broader buy-and-sell decision framework for traders.
Supercharge your portfolio.
Start now for free.

