treynor ratio
DEFINITION: The Treynor ratio is a measure of the relationship between risk and reward that reflects the performance of a portfolio relative to the performance of a selected risk-free benchmark.

Graphic showing the definition of the term Treynor Ratio.
The Treynor ratio is a measure of the relationship between risk and reward that reflects the performance of a portfolio relative to the performance of a hypothetical risk-free benchmark.
The ratio may also be referred to as the Treynor Index.
It was developed by Jack Treynor, an economist who contributed to the invention of the Capital Asset Pricing Model, which is widely used to set prices for high-risk securities.
What is a good Treynor ratio?
The higher a portfolio’s Treynor ratio is, the better it is trading risk for reward.
For example, a portfolio with a Treynor ratio of 7.14 is considered to be a better investment than one with a Treynor ratio of 2.27, because the former is more efficiently earning reward for the amount of risk it is taking on.
Because this metric is a ratio—expressing a statistical relationship between a portfolio and benchmark—there is no particular threshold that would determine a “good” investment.
The same ratio of 2.27 mentioned above may be considered particularly good if market conditions mean that portfolios in general are earning very little reward for risk.
How to calculate the Treynor ratio
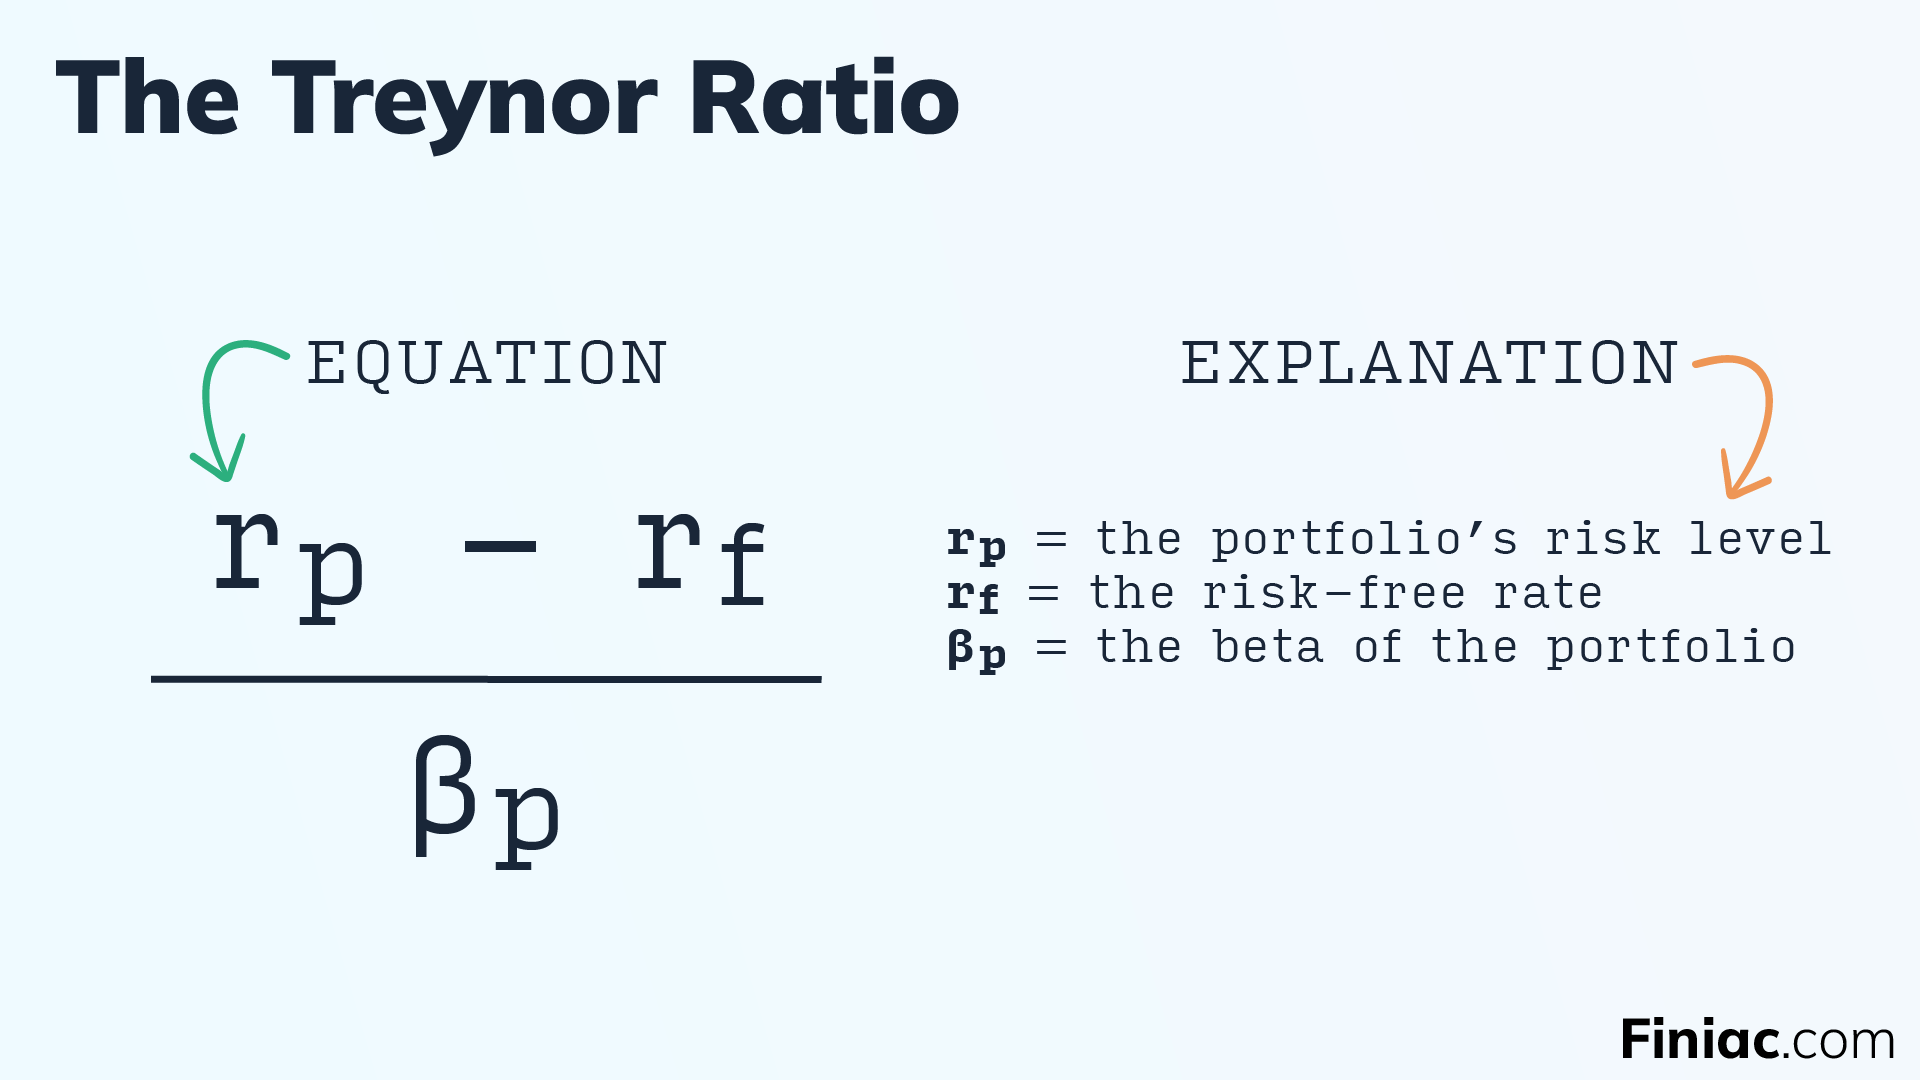
Graphic showing the Treynor Ratio equation, explained.
A bit more explanation:
rp = Your portfolio’s actual return, as a percentage.
rf = Risk-free rate of return during the same period. Most often, this rate is sourced from US Treasury bills, or from a traditional savings account. In both of those cases, the risk of losing value is extremely low. The rate of return is often around 1%.
βp = The volatility of the portfolio relative to a market benchmark, like the S&P500. In this equation, the volatility of the benchmark is used as proxy for systemic risk.
Supercharge your portfolio.
Start now for free.

