kurtosis
DEFINITION: A statistical measure that describes the degree of peakedness or flatness of a distribution. A distribution with more data points near its center and fewer data points near its tails is called platykurtic, while a distribution with fewer data points near its center and more data points near its tails is called leptokurtic.
Kurtosis is a statistical measure that describes the degree of peakedness or flatness of a distribution.
A distribution with more data points near its center and fewer data points near its tails is called platykurtic, while a distribution with fewer data points near its center and more data points near its tails is called leptokurtic.
Kurtosis can be used to compare distributions, to identify outliers, and to understand the properties of a given distribution.
Examples of kurtosis
These two examples are histograms, showing the distribution of daily returns for stocks. Green bars represent positive returns; red bars represent negative.
A platykurtic histogram distribution:

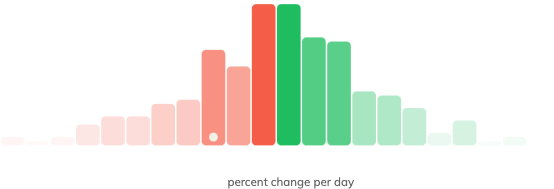
Example of a platykurtic histogram.
A leptokurtic distribution:
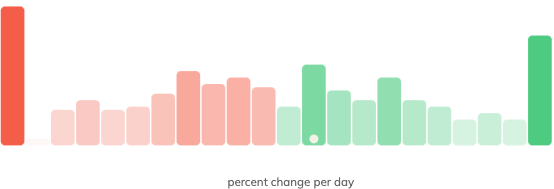
Example of a leptokurtic histogram.
Leptokurtic distributions are often said to have “fat tails,” given the distribution that favors the top and bottom ends of the spectrum.
When reading a histogram for a
Kurtosis and Skewness
The expected distribution of results is referred to as the bell curve. Kurtosis, on its own, simply describes the distribution of returns. Skewness, on the other hand, specifically quantifies the deviation of returns away from the expected bell curve.
Kurtosis in Finiac
Kurtosis essentially is a graphical representation of volatility, which is the core way that we look at assets in Finiac.
When you’re assessing the risk of owning a particular asset, like a stock or a crypto, it’s essential to see how widely its returns vary from day to day. We use histograms, like the ones above, to show you that in just a quick glance.
Supercharge your portfolio.
Start now for free.

